Data collected: Number of temperature data collected hourly by the dataloggers of the monitoring systems from 2012
Days: The total lenght in days of the monitoring activity
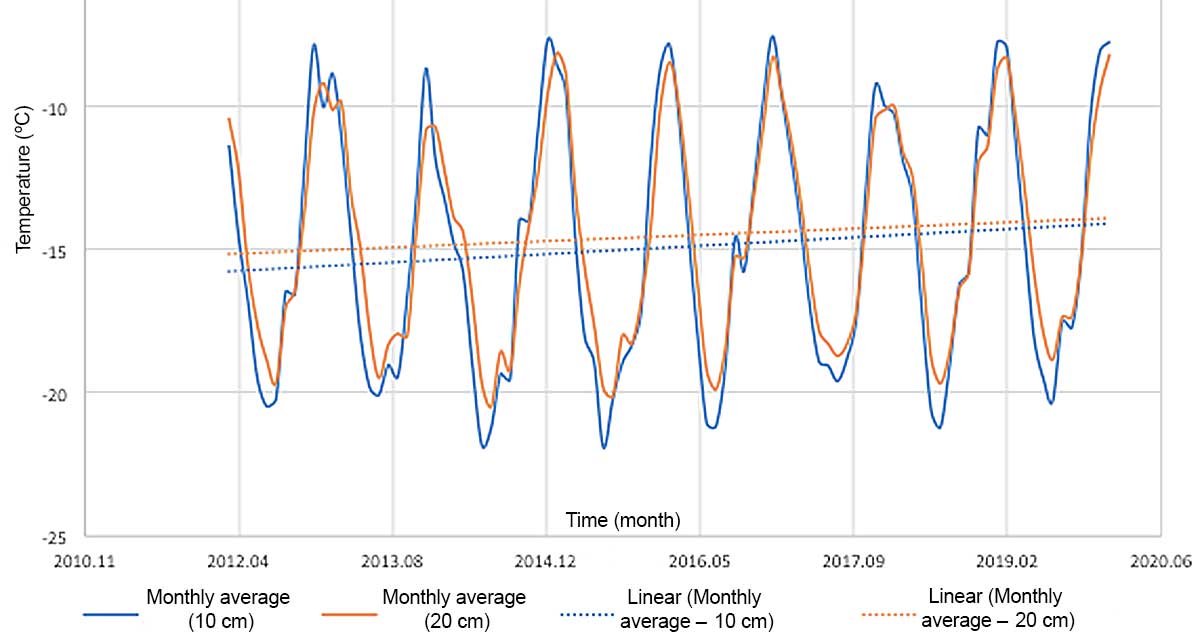
Temperature change: Warming of the regolith (-10 cm) on the Ojos del Salado at 6750 m a.s.l. based on mean monthly temperatures (2012-2020)

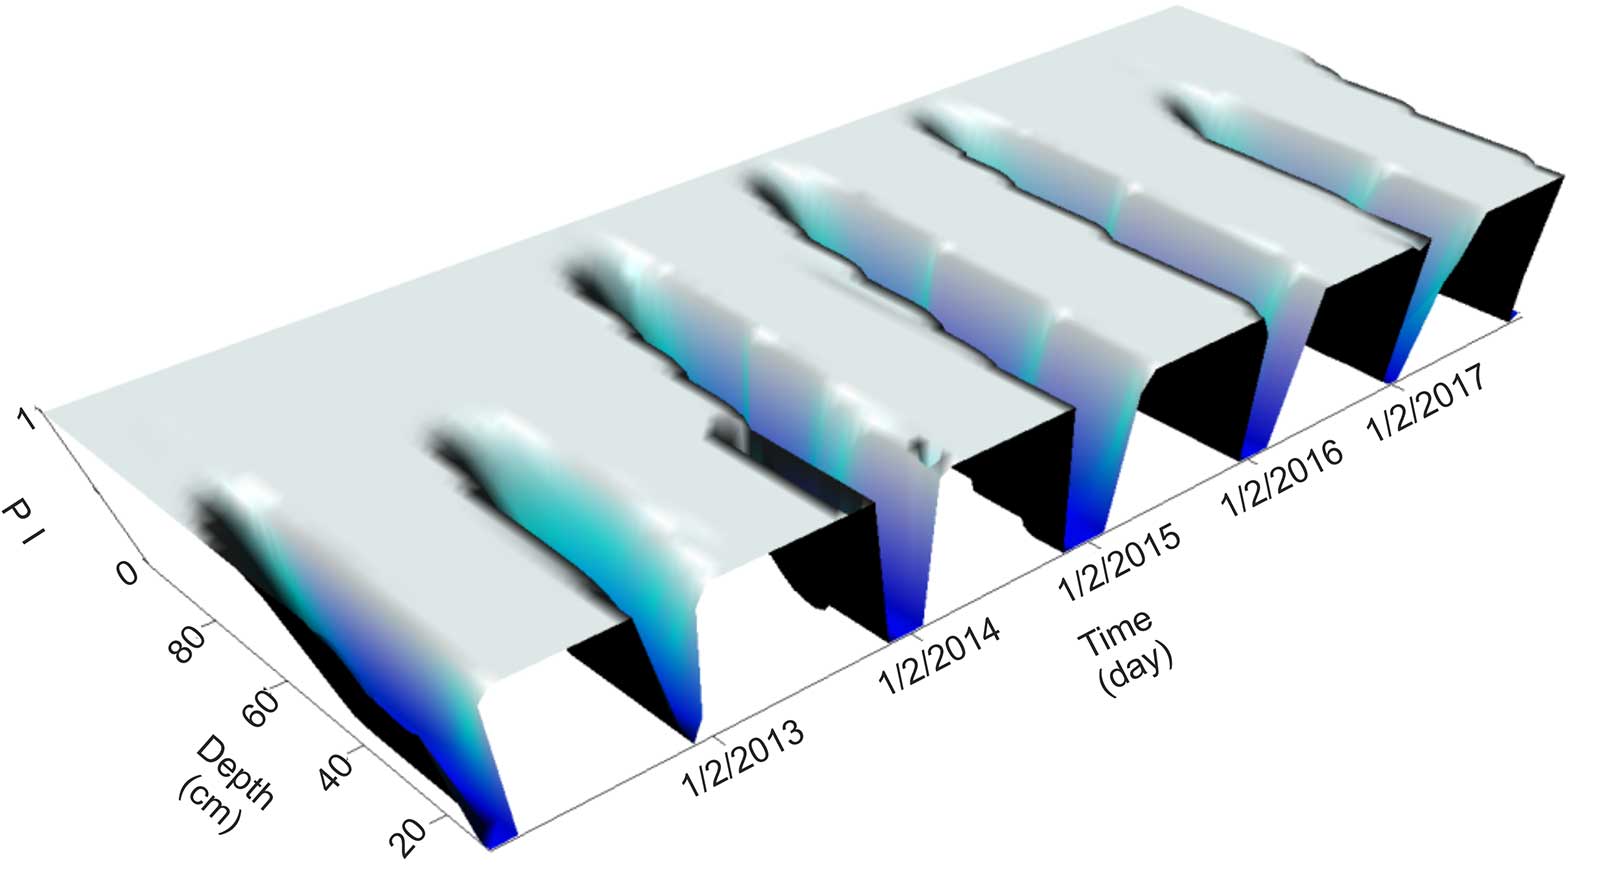
3D visualization of the change of the phase index (PI) due to temperature change in the regolith, at -10 to -100 cm depths on the Ojos del Salado at 5830 m a.s.l. (2012-2018). Scale from blue to light grey representing water (PI=0) to ice (PI=1), the six depressions show the progress of thawing during the six years


